
Cancer survival: due to patient or healthcare system characteristics?
Cancer survival is improving and has doubled in the last 40 years in the United Kingdom. However, the increase in survival has not been the same for everyone: it is leaving behind those who are more deprived.

Figure 1: Five-year relative survival (%) by deprivation category (detailed later) and calendar period of diagnosis in England and Wales. Relative survival, or net survival, is the survival probability derived solely from the cancer-specific hazard (risk) of dying and is independent of the general population mortality, i.e., competing risks of death.
Figure courtesy of Bernard Rachet, Inequalities in Cancer Outcomes Network
Until the early 2000s, less than half of people diagnosed with cancer were expected to live for five years. Since the introduction of the National Health Service’s (NHS) Cancer Plan in 2000, cancer survival has rapidly increased. The NHS Cancer Plan, and successive cancer policies, recognised the importance of an earlier diagnosis on the chances of a good prognosis. Thus, there was a greater drive to increase the proportion of patients diagnosed at an earlier stage.
Over the past two decades, the proportion of patients having their cancer detected earlier has dramatically increased, contributing to the rise in cancer survival. This trend is in large part due to factors such as awareness campaigns (e.g., association of smoking and risk of lung cancer), cancer screening initiatives (e.g., checking for lumps in breast cancers), and advancements in treatments and technology (e.g., positron emission tomography and computed tomography scans).
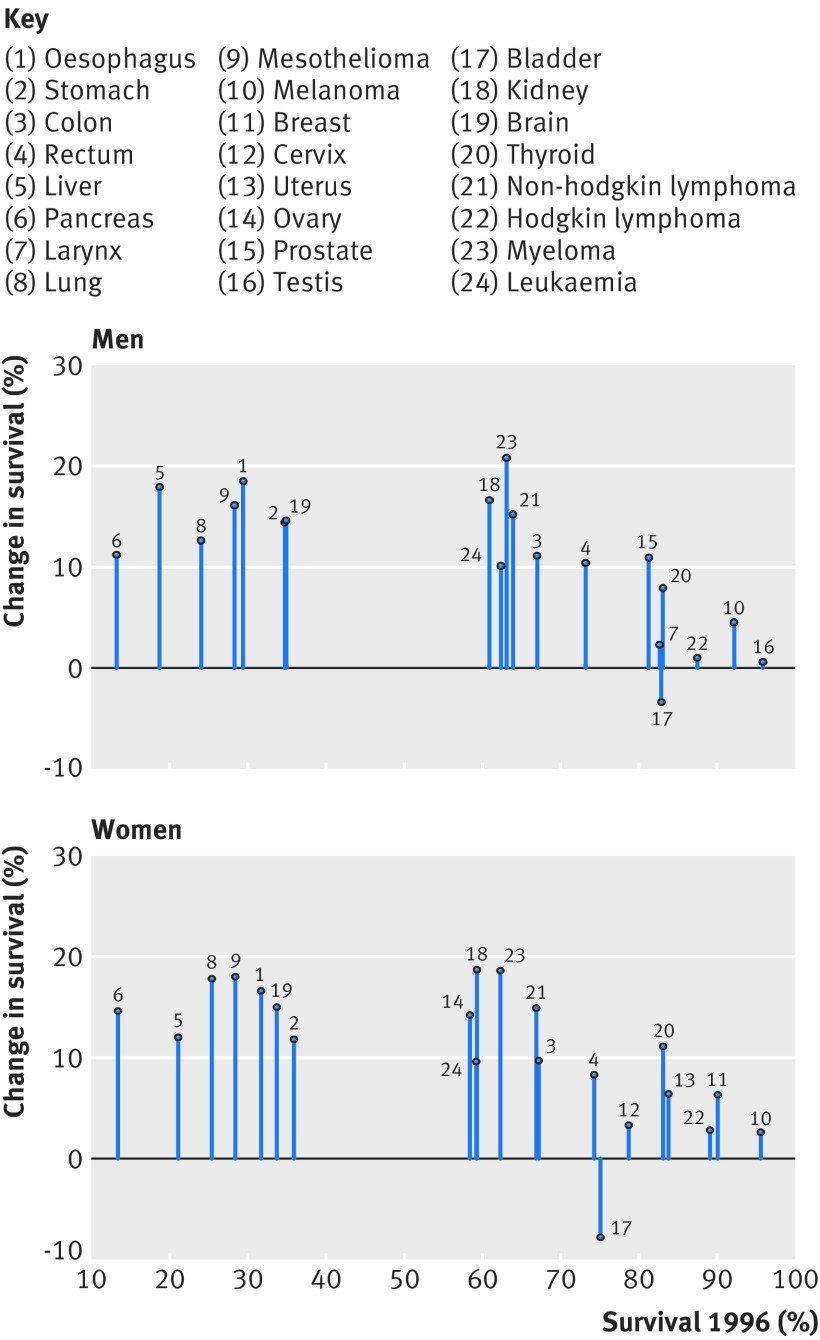
Figure 2: Change in one-year net survival between 1996 and 2013 for 20 cancers in men and 21 cancers in women. For example, amongst women, patients with pancreatic cancer had the lowest survival in 1996 but survival increased by approximately 15% by 2013.
Figure courtesy of Aimilia Exarchakou, Inequalities in Cancer Outcomes Network
In population-based cancer survival research, the measure of deprivation has evolved from a composition of Karl Marx’s structural and Max Weber’s societal perspectives. It is defined as the socially derived economic factors that influence what positions individuals or groups hold within the multi-faceted structure of society. Deprivation is a contextual measure of not only income but of one’s opportunities within their immediate area that are identified by several domains (employment, education, etc.). An individual’s assigned deprivation level is determined by the rank of their area relative to other areas in terms of a weighted combination of the domains. Thus, an individual’s level of deprivation is (i) an ecological measure and (ii) relative to other individuals. The latter is an important characteristic to consider since the areas with lower ranks are interpreted as more deprived areas compared to areas with higher ranks: they are not necessarily all deprived areas.
However, for some cancers, survival amongst those living in least deprived areas has improved faster than in more deprived areas. In other words, an unexpected but obvious phenomenon has occurred: there has been a marginal increase in survival, but the difference between deprivation groups has grown wider. Amongst males, the greatest widening was observed for melanoma, prostate, colorectal, and haematological malignancies; amongst females, it was gynecologic cancers. What is less obvious but no less important is that, apart from lung and brain cancers, the deprivation gap for any cancer has not narrowed. The bottom line is that these cancer plans have not targeted all patients equitably; they have missed patients who are living in more deprived areas.
Reasons for persistent inequalities
Unless the deprivation gap in survival is addressed, these inequalities are expected to persist or even widen in some cases. Cancer survival is often described by patient characteristics, such as sex, ethnicity, or socioeconomic level. This has contributed to a common public misconception that patients with certain characteristics are predetermined to have lower chances of survival; however, patient characteristics account for approximately only a third of the socioeconomic inequalities. In fact, most of the socioeconomic inequalities in survival are due to unknown factors (other than patient characteristics). Optimal interactions between the patient and the healthcare system around the time of cancer diagnosis can drastically increase a patient’s chances of a better prognosis. Such optimal interactions include: effective communication during a general practitioner (GP) appointment, distinguishing between comorbid and cancer-related symptoms, being referred from a GP to a consultant within two weeks, and promptly receiving the diagnostic test and results. The problem is that these optimal interactions are less likely to be experienced by those in more deprived areas.
The current framework for cancer diagnoses is the rapid diagnostic and assessment pathway, such as the colorectal cancer diagnostic pathway (Figure 3). The aim of the diagnostic pathway is to ensure patients receive the outcome of diagnostic tests within 28 days of referral. Indeed, reducing the time that a patient is on the diagnostic pathway will contribute to an earlier diagnosis. However, to be fully effective it is crucial that the diagnostic pathway starts when the cancer is in its early stages—in reality, patients may have cancer months before they have the consultation with a GP that initiates the pathway. The diagnostic pathway could be thought of as a product of a company that is accessible to those who can “afford” it in a society where the currency is “privilege of accessible healthcare services”. It is not the function of the diagnostic pathway that is systematically biased, it is inaccessibility that induces bias.
The diagnostic pathway is susceptible to two major flaws resulting from access: GP availability and testing capacity. Firstly, the number of GPs within any area must be proportional to the size and healthcare requirements of the population they care for. Without this proportionality, those living in areas with less GPs may have a reduced chance of accessing the diagnostic pathway. Secondly, the number of specialists and the capacity of diagnostic facilities that feature along the pathway must be proportional to the demand of any area they care for. Without this proportionality, those living in areas with unavailable diagnostic specialists or facilities will have a reduced chance of receiving a definitive diagnostic result (including earlier diagnosis) within 28 days of a GP referral.

Figure 3: Colorectal cancer rapid diagnostic pathway. (MDT: multidisciplinary team, GP: general practitioner, CT: computed tomography, OGD: gastroscopy, CEA: carcinoembryonic antigen test, CNS: clinical nurse specialist, MRI: magnetic resonance imaging, TRUS: transrectal ultrasound.)
Figure courtesy of NHS Cancer Programme (NHS England)
To elaborate on the first flaw (GP availability), the number of GPs is not only lower in more deprived areas compared to least deprived areas, but there is an exodus of GPs across England, leading to a comparatively higher workload for GPs who do work in these areas. Moreover, GP time for each patient is, on average, lower in more deprived areas compared to least deprived areas, even for patients with comorbidities. This is an example of the inverse care law: those who most need care are the least likely to receive it. Higher workload for GPs, in combination with reduced GP time, increases the chances of missing ‘red flags’ of cancer symptoms. Furthermore, more deprived areas tend to be more densely populated and have a higher prevalence of patients with comorbidities. More densely populated areas are likely to have a healthcare service with a higher demand, leading to an increased chance of patients being diagnosed through emergency route, which is closely correlated to a later cancer stage at diagnosis. A natural, and foreseeable, consequence is a future with a reduced number of cancer patients from deprived areas on the diagnostic pathway, ultimately leading to the sustained deprivation gap in cancer survival.

Figure 4: Number of registered patients per GP by clinical commissioning groups (CCGs) in order of deprivation level.
Figure courtesy of The Health Foundation
To elaborate on the second major flaw (testing capacity), a key phase of the cancer diagnostic pathway is during Days 3 and 14 (the Straight to Test [STT] phase), when the cancer-specific test is expected to occur. One commonly required procedure is a computed tomography (CT) scan, which is carried out by a radiologist. The same issues around accessibility materialise again: not only is there a radiologist shortfall, but millions are spent on scan outsourcing. Some of the key findings of the Royal College of Radiologists’ (RCR) annual census (2020) were that the UK radiologist workforce is now 33% short-staffed, with a projected rise to 44% by 2025. Additionally, consultant attrition remained at an average of 4% within the UK. Previous data from the RCR highlighted that scan outsourcing in 2017 rose by 32% since 2016. The cost of scan outsourcing (paying private companies to help with the workload) was estimated to be £116m in 2017 (enough to pay 1,300 full-time radiologists). With no clear influx of radiologists, and an increasing demand for CT scan usage over the next few years, the deprivation gap in cancer survival is unlikely to narrow.
Reducing inequalities
There are multiple factors contributing to socioeconomic inequalities. However, increasing the NHS budget to improve the ratio of patients to GPs and radiologists would drastically reduce the deprivation gap in cancer survival. The healthcare system can only go so far as to be more efficient with the same budget; each year, there is a higher demand for additional services that heavily outweighs the annual increase of the NHS budget. Even advanced technology, such as artificial intelligence in cancer diagnosis, comes with its own inherent inductive bias that may itself contribute to the deprivation gap in survival. Without the appropriate capacity for demand in the areas where care is most needed, it is unlikely that we will see a reduction of the socioeconomic inequalities in cancer survival and the true potential of faster cancer diagnostic pathways.